
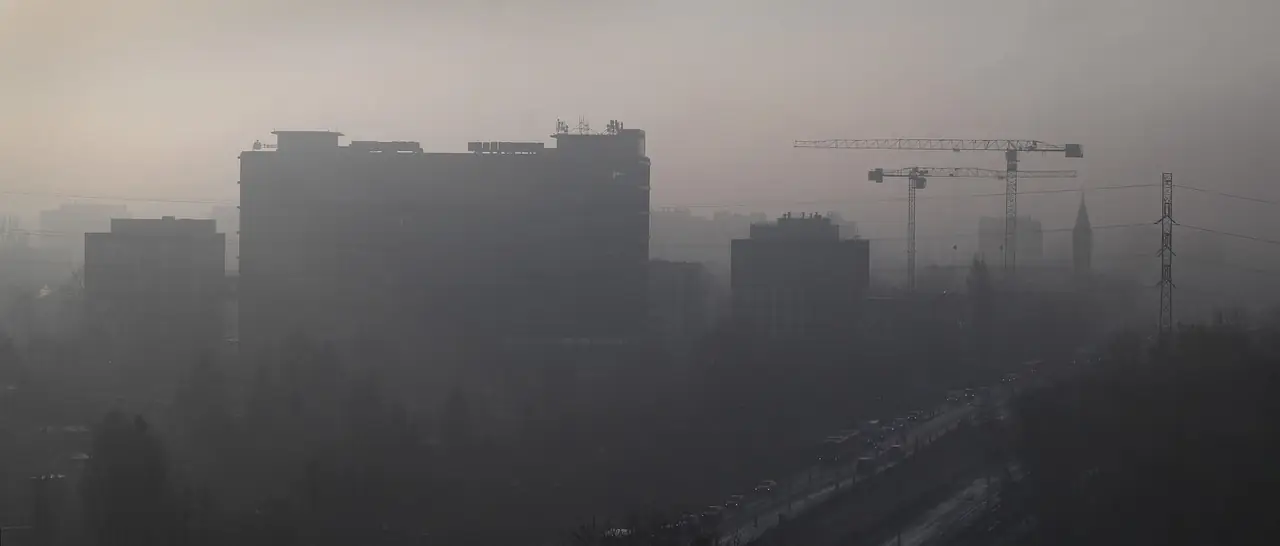
What is the difference between PM2.5 and AQI?
PM2.5 is something you can measure: the concentration of fine particles small enough to reach deep into the lungs, in micrograms per cubic metre (written µg/m³). AQI, the air quality index, is a score someone derived from it. Each country picks its own breakpoints, so the same score on a US-based website and on an Indian or Chinese one is not the same level of particles. When you compare places, compare PM2.5, and when a site only gives AQI, check which scale it uses.
Two reference points are useful for nomads:
- The WHO 2021 guidelines: 5 µg/m³ as a yearly average and 15 as a 24-hour average. They are health-based targets, and almost nowhere we track meets the yearly one. Many pages still quote 25 for the 24-hour limit, the 2005 value; the 2021 figure is 15.
- The US scale (EPA, revised in May 2024, when the top of Good moved from 12 to 9): the 24-hour PM2.5 bands are Good up to 9, Moderate 10 to 35, Unhealthy for Sensitive Groups 36 to 55, Unhealthy 56 to 125, Very Unhealthy 126 to 225, and Hazardous above that. Most travel sites show this scale.
Where to be next: your month-by-month route, $19
A route for your months with a leave-by date for each stop, a backup, and the seasonal traps on your path. Drafted from 11 years of weather data, every number checked against it, in your inbox within 48 hours. Not included: visas, insurance or bookings.
What does that look like in real places?
Here is the same quantity for three places that nomads compare, from the CAMS air-quality model through Open-Meteo, the monthly average of daily fine particles over 2023 to 2025:
Average PM2.5 by month, µg/m³ (model, 2023-2025)
| Jan | Feb | Mar | Apr | May | Jun | Jul | Aug | Sep | Oct | Nov | Dec |
|---|---|---|---|---|---|---|---|---|---|---|---|
| Hanoi | |||||||||||
| January: 53 | February: 40 | March: 47 | April: 55 | May: 40 | June: 40 | July: 41 | August: 47 | September: 41 | October: 39 | November: 44 | December: 52 |
| Bangkok | |||||||||||
| January: 54 | February: 50 | March: 41 | April: 30 | May: 24 | June: 13 | July: 10 | August: 11 | September: 15 | October: 37 | November: 30 | December: 31 |
| Krabi | |||||||||||
| January: 12 | February: 12 | March: 14 | April: 12 | May: 8 | June: 9 | July: 10 | August: 7 | September: 7 | October: 6 | November: 7 | December: 8 |
Model values on a grid of about 45 km, mean of 2023-2025 · How we measure
Read against the bands above (they are meant for a single day, so this is a rough reading): Hanoi's January average of 53 sits near the top of the US Sensitive Groups band, and Bangkok's 54 is in the same band. Krabi's 12 is Moderate on the US scale and under the WHO daily guideline of 15. In July, Bangkok drops to 10 and Krabi to 10, while Hanoi stays at 41. See Hanoi air quality by month and Bangkok air quality by month for every month.
Why do two sites show different numbers for the same city?
Three reasons, and it helps to know which one you are looking at. First, one site shows micrograms and the other a score. Second, one reads a ground sensor, maybe on a busy road or a school roof, and the other a satellite-and-model estimate for a wide area. Third, the time window differs: a live reading is the last hour, while the guidelines are 24-hour averages. A traveller who sees a red number on one app and a green one on another is usually comparing two different things, not catching one of them in a lie.
When we describe a place we use the same source for every place and every month, so that the comparison is fair, even though it is not the number on your street. That is also why we show months side by side and say where the model is weak. The model smooths a city into a grid of about 45 km, so the narrow lanes of an old town, a ring road, or a burning field a few kilometres away will not appear in it.
Why is a monthly average not a safe-day guarantee?
An average smooths the peaks. A month that averages 53 (Hanoi, January) contains days far above and below it, and a model on a 45 km grid reads below a street-level sensor on the worst days. In our model data, Hanoi's January averaged 58 in 2023, 31 in 2024 and 71 in 2025: the same month, a factor of more than two apart.
That is why we use these numbers to compare months and places, and not to predict a particular day. For the day, use a live source near where you will sleep, and check how old the reading is.
How should you use the numbers to pick a base?
- Compare like with like. If one source gives AQI and another gives micrograms, convert before you compare.
- Use the season you will be there. Our cleanest air by month page compares 17 places in the winter and summer months, because the ranking flips.
- Look at the range as well as the mean. Our Kathmandu air quality page shows how far one month can swing between years.
- Treat smoke seasons as events, not averages. Chiang Mai's burning season runs roughly February to April, and our weekly chart shows which weeks are worst.
We give no health advice, and the bands above are descriptions of scales, not a judgement on any person's situation. If you are sensitive to polluted air, speak to a doctor before planning a long stay.
About this data
Our figures are daily PM2.5 averaged by month from the CAMS global air-quality model through Open-Meteo (CC BY 4.0), one point per place, mean of 2023 to 2025. They are model values, not ground sensors, and read below stations on bad days. The EPA bands are from the US AirNow scale as revised in 2024; WHO values are from its 2021 guidelines.
Frequently asked questions
What is the difference between PM2.5 and AQI?
PM2.5 is the amount of fine particles in the air, in micrograms per cubic metre. AQI is a score that converts that amount, and other pollutants, into a 0 to 500 style scale with colour bands. The same PM2.5 gives a different AQI in different countries.
What is a good PM2.5 level?
The WHO's 2021 guidelines are 5 for a yearly average and 15 for a 24-hour average, in micrograms per cubic metre. The US scale calls up to 9 for a day Good, and above 35 it starts to warn sensitive groups.
Why does an air quality website show a higher number than a weather app?
They may use different measures. One shows PM2.5 in micrograms, another shows an AQI score, one is a ground sensor and another is a model. A model averaging a 45 km grid reads below a street sensor on a bad day.
Can I use a monthly average to plan a stay?
Yes for comparing months and places, no for knowing how a single day will be. In Hanoi, January averaged 58 in 2023 and 31 in 2024 in our model, so one average hides a lot.
Not sure where yet? Pick your months and what to avoid, and get your 3 best places → Where should I go?
Weather data: Open-Meteo (CC BY 4.0), open-meteo.com; rain totals: CHIRPS (Climate Hazards Center, UC Santa Barbara). Processed by NomadWeather from stored copies of the data.