
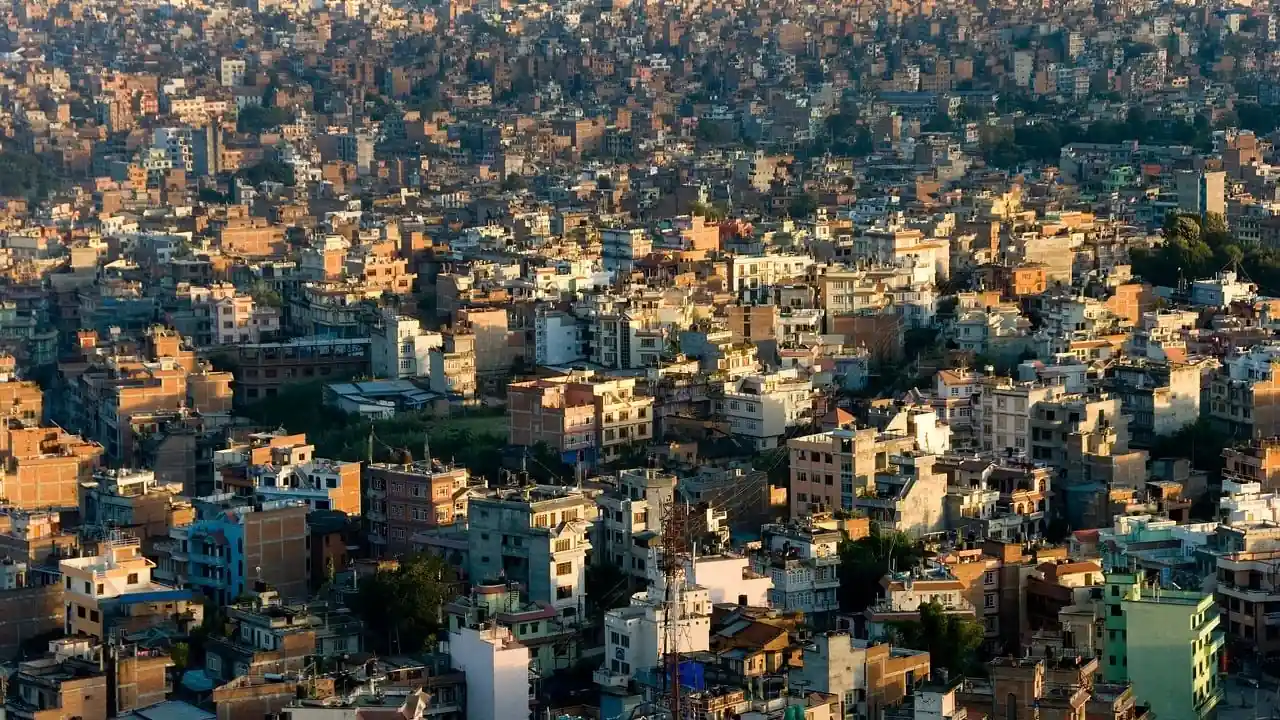
When is Kathmandu's air worst?
In the dry winter, with a second peak in spring; the cleanest months are July to September, and October to November is the trekking window, though November is already high. In more detail: the valley is a bowl. Cold, still air sits in the bowl-shaped valley under a temperature inversion, and traffic, brick kilns, rubbish and household burning pile into it. ICIMOD, the regional mountain research centre, describes a winter of little relief for valley residents, and the Kathmandu Post's editorial on winter air blues says the same. In spring, forest fires add smoke: a March 2026 report describes haze over Nepal for nearly a week.
Our own history is from the CAMS air-quality model through Open-Meteo for central Kathmandu, averaged over 2023, 2024 and 2025, with Pokhara under it:
Average PM2.5 by month, µg/m³ (model, 2023-2025)
| Jan | Feb | Mar | Apr | May | Jun | Jul | Aug | Sep | Oct | Nov | Dec |
|---|---|---|---|---|---|---|---|---|---|---|---|
| Kathmandu | |||||||||||
| January: 55 | February: 48 | March: 37 | April: 33 | May: 33 | June: 33 | July: 20 | August: 20 | September: 20 | October: 26 | November: 41 | December: 53 |
| Pokhara | |||||||||||
| January: 28 | February: 25 | March: 19 | April: 20 | May: 18 | June: 17 | July: 10 | August: 9 | September: 10 | October: 12 | November: 19 | December: 25 |
Model values on a grid of about 45 km, mean of 2023-2025 · How we measure
December to February is the worst stretch: 53, 55 and 48 µg/m³. From March to June the average stays at 32 to 37, then the monsoon clears it to 20 in July, August and September. The turn back is fast: October reads 26 and November 41.
Where to be next: your month-by-month route, $19
A route for your months with a leave-by date for each stop, a backup, and the seasonal traps on your path. Drafted from 11 years of weather data, every number checked against it, in your inbox within 48 hours. Not included: visas, insurance or bookings.
How much does one year differ from another?
Very much. January averaged 52 in 2023, 40 in 2024 and 74 in 2025, and November was 24 in 2023 and 58 in 2024. The three-year average is a good guide to when, but a poor forecast for how bad. The model also averages an area about 45 km across and tends to read low in valleys on bad days, so real readings on a bad morning are higher than these averages.
Is Pokhara cleaner?
Yes, in every month, at about half the level. Pokhara averaged 28 µg/m³ in January against 55 in Kathmandu, 19 against 37 in March and 12 against 26 in October. It is a lake city at a lower altitude in a more open valley, and it has its own pre-monsoon haze in spring. Air is not the only difference: winter is cold in both, and Pokhara's wet season is heavy. The model also puts Pokhara's cleanest months in the same place as Kathmandu's, July to September, at 9 to 10 µg/m³ against 20, so the monsoon is the one time both are at their best for air and at their worst for rain.
Where to go instead: Pokhara
Pokhara
Lower than Kathmandu in every month: 28 µg/m³ in January against 55, and 12 in October against 26. A lake city with a more open valley, but its own pre-monsoon haze in spring and a heavy monsoon.
Suits: people who want a winter base with better air and are happy to visit Kathmandu for a week
What does a Kathmandu winter feel like for someone who works there?
The reports describe a long grey stretch, not a single event. The sources are the same all year: vehicles, brick kilns, rubbish burning and cooking fires. In winter the valley's shape stops them leaving: cold air pools in the bowl, there is little wind, and rain is rare from November to February. That is why the winter months stack up in the strip rather than showing a short spike.
The practical result for a long stay is that the choice of month matters more here than in most places: the same city is about two and a half times as polluted in January as in July. If your work only needs a good connection, you can choose. If you want the trekking season, October to November is the classic window, and November can already be bad: 58 µg/m³ in 2024, 24 in 2023.
How would you plan around it?
- Avoid December to February in Kathmandu if air matters to you. If you must be there, expect the worst in January.
- October is the best shoulder month, before November's jump, though all three years had 4 to 8 days above 35 µg/m³.
- Spring is not clean either. March to May is clearer than winter, with fire smoke on some days.
- Spend winter in Pokhara and visit Kathmandu for a week, not the other way round.
- Compare other winter bases. Hanoi is high all year, Bangkok has a clear winter season, and Bali has a different problem in the dry months; where is warm in January ranks bases on weather alone.
- Check live readings by district, and note how old the reading is, before you sign a rental.
We give no health advice here. If you are sensitive to polluted air, speak to a doctor before planning a long stay.
About this data
Daily PM2.5 averaged by month from the CAMS global model through Open-Meteo, mean of 2023 to 2025, one point per city. A model cannot see a single road or a bad hour. Use it to compare months and places.
Frequently asked questions
When is the air worst in Kathmandu?
December to February in our model data (53, 55 and 48 µg/m³ on average for 2023 to 2025). News and ICIMOD reports describe the same winter peak, and a second one in March to May from forest fires.
When is the best time for clean air in Kathmandu?
July to September, the monsoon, at about 20 µg/m³ on average. That is still above the WHO daily guideline of 15, and it is the rainy season.
Is October a good month in Kathmandu for air?
Better than winter: October averaged 26 µg/m³ in our model, but November is already 41, and in 2024 it jumped to 58.
Is Pokhara's air better than Kathmandu's?
In our model, yes in every month, about half the level. Pokhara averaged 28 µg/m³ in January against 55 in Kathmandu.
Does it change from year to year?
A lot. January averaged 52 in 2023, 40 in 2024 and 74 in 2025 in our model.
Not sure where yet? Pick your months and what to avoid, and get your 3 best places → Where should I go?
Weather data: Open-Meteo (CC BY 4.0), open-meteo.com; rain totals: CHIRPS (Climate Hazards Center, UC Santa Barbara). Processed by NomadWeather from stored copies of the data.